
Inside the Analytical Challenges of Measuring Microplastics
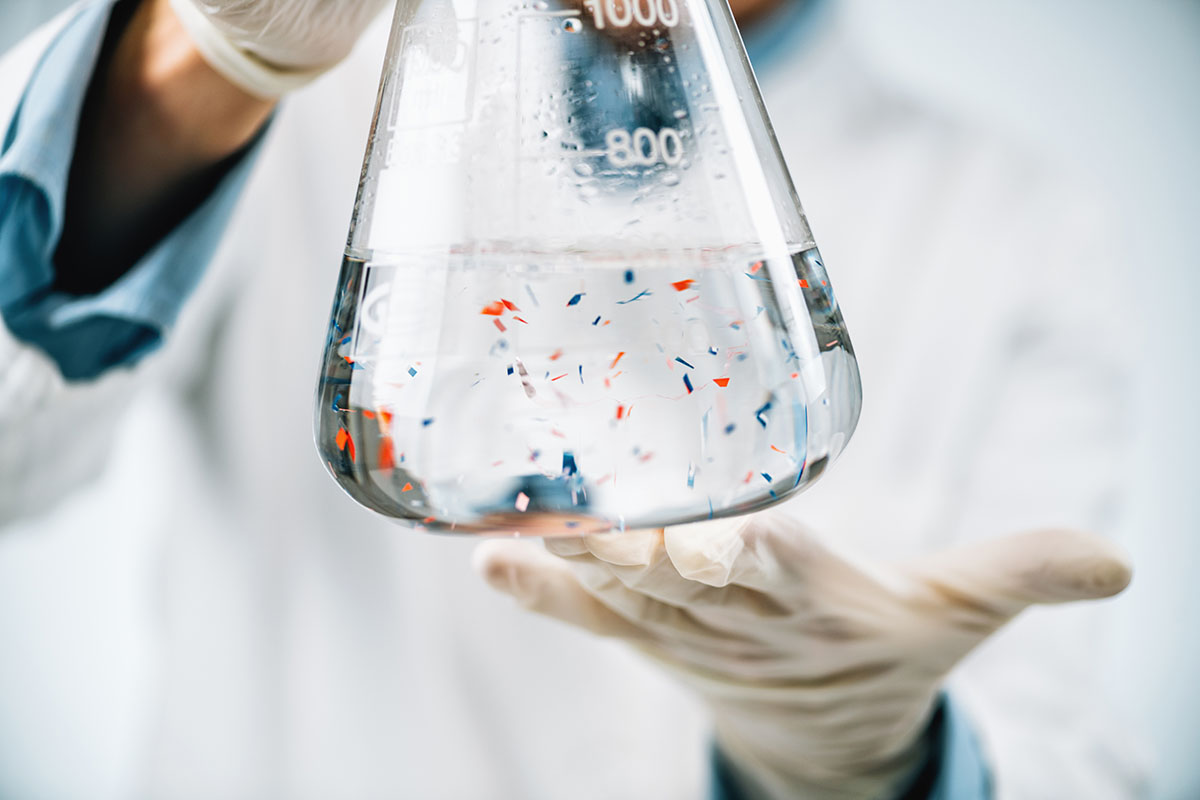
Measuring microplastics requires reliable detection, contamination control, validated methods, and reproducible analytical results.
Researchers studying microplastics face challenges that go beyond simply finding small plastic particles. They must distinguish plastics from thousands of non-plastic particles, prevent contamination during sampling and analysis, select methods with appropriate size limits, and interpret results using defensible statistical approaches.
You can also read: Microplastics and Nanoplastics: Hard to See, Harder to Stop
These challenges intensify as particle size decreases. As plastics fragment, particle numbers can increase substantially at smaller size ranges. At the same time, smaller particles become harder to separate from environmental matrices and more difficult to identify with sufficient chemical specificity.
The Tradeoff Between Speed and Sensitivity
Infrared spectroscopy is widely used in microplastics research because it can identify polymers non-destructively. However, faster analysis does not always mean better detection. A Dow-led study evaluated laser direct infrared spectroscopy (LDIR) using a discrete-frequency, image-guided approach. Instead of collecting full spectral information across the entire sample area, the system first scans selected infrared frequencies to locate likely particles. It then collects spectra only from those targets. This strategy reduces the time spent analyzing background material and non-target particles, improving overall analytical throughput.
That speed gain, however, depends on how well the selected scanning conditions distinguish target particles from the surrounding matrix. Under several conditions, the researchers identified more than 90% of spiked polyethylene particles larger than 20 µm. They also detected about 94% of PMMA particles between 5 and 20 µm with an appropriate substrate and scanning frequency. Still, performance changed with wavelength selection, sensitivity settings, and substrate properties. Higher sensitivity can help detect weaker signals and smaller particles, but it can also increase the number of non-target particles selected for further analysis. Lower sensitivity can reduce the analytical workload, although it may miss some particles.
The tradeoff becomes more challenging as particle size decreases. Environmental samples can contain tens of thousands of organic and inorganic particles, increasing potential interferences. At smaller size ranges, density separation also becomes less efficient, while incomplete digestion can leave residual organic material in the sample. As a result, researchers must balance throughput, sensitivity, and selectivity rather than optimizing one factor alone. Faster screening can make large sample sets more practical, but reliable microplastics analysis still depends on selecting conditions that capture target particles without introducing excessive background or overlooking weaker signals.
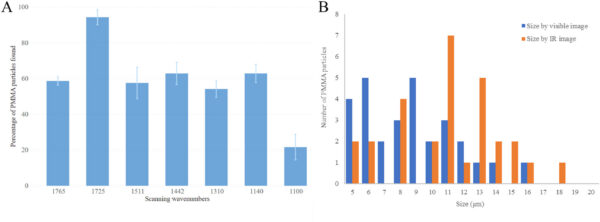
Percentage of PMMA particles found at different wavenumbers. B: Size of particles determined by visible (blue) and IR (Orange) images. A wavenumber of 1725 cm−1 and high sensitivity was used for particle scanning, and the chemical identification of PMMA particles was confirmed by the IR spectra. Courtesy of Discrete frequency infrared-guided image for microplastic analysis: Performance and limitations.
Contamination Can Change the Result
Microplastics are so widespread that avoiding contamination is an analytical challenge in itself. A 2026 statistical review from Dow researchers argues that many microplastics studies rely too heavily on procedural blanks, which may not represent contamination introduced during sampling, transportation, or storage. The authors recommend field blanks that match the environment and handling conditions of real samples.
The study also emphasizes that detection limits are not fixed values that can be applied mechanically. Their validity depends on blank sample size, statistical distribution, multiple comparisons, and, for particle-count data, the fraction of the filter inspected.
This distinction matters because detection and quantification are not the same. A measurement above a defensible detection limit may support detection of a target polymer or particle signal above background. However, estimating how much material is present requires replication and appropriate uncertainty analysis.
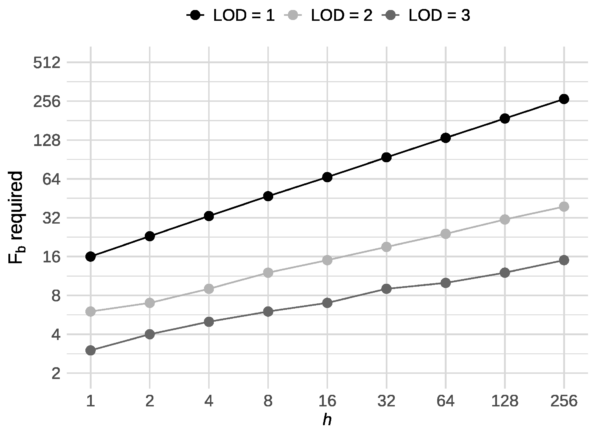
Minimum number of blank filters 𝐹𝑏 with zero particles required for LOD=𝑘 where 𝑘=1,2,3 vs. the number of comparisons h with 𝐹𝑠=1 and 𝜋𝑏=𝜋𝑠. The curves summarize an evidence requirement—achieving LOD = 1 demands disproportionately more zero-count blanks than LOD = 2 and LOD = 3 do across h levels. Courtesy of Detection and Quantification Challenges in Microplastics Research: A Statistical Overview.
The Matrix Can Look Like Plastic
Even sophisticated analytical methods can produce false positives. Pyrolysis-gas chromatography/mass spectrometry (Py-GC/MS), for example, identifies and quantifies polymers based on their characteristic thermal decomposition products. However, because the technique destroys the particles during analysis, it measures polymer mass rather than preserving information about individual particle number, size, or morphology.
Additionally, researchers recently showed that long-chain fatty acids and waxes in biological matrices can produce pyrolysis fragments similar to polyethylene. Automated software relying on a small number of non-unique ions incorrectly identified some of these compounds as PE.
Sample preparation can further complicate interpretation. The researchers found that KOH digestion altered fatty-acid products in ways that made them more closely resemble polyethylene, while double-shot pyrolysis only partially reduced those interferences.
Their conclusion was straightforward: analysts must validate matrix-removal procedures, examine broader chromatographic patterns, and avoid relying on a single chemical marker.
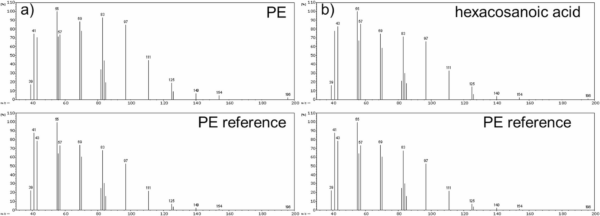
MP analysis using Frontier Laboratories F-Search software for (a) a PE sample versus a PE reference and (b) a hexacosanoic acid sample versus a PE reference. Courtesy of Opportunities to improve polyethylene microparticle analysis by pyrolysis-gas chromatography/mass spectrometry.
What Counts as a Representative Microplastic?
Even when researchers identify a particle correctly, another question remains: does that particle actually represent the microplastics found in the environment?
Many laboratory studies use commercially available polystyrene microspheres because researchers can obtain them in controlled sizes with consistent properties. However, those particles differ substantially from the heterogeneous plastics generated through use, degradation, and weathering in real environmental conditions.
Laboratory Particles vs. Environmental Microplastics
| PS type | Typical shape & size | Typical surface functionality | Typical chemical composition of the bulk material | Typical additional components |
|---|---|---|---|---|
| Commercial GPPS | Pellet, >1 mm | No | PS | Antioxidants, fillers |
| Commercial HIPS | Pellet, >1 mm | No | PS and butadiene-styrene copolymer | Antioxidants, fillers |
| Commercial EPS | Foamed bead, >1 mm, converted to molded shapes and boards | No | PS | Antioxidants, fillers, flame retardants possible |
| Commercial XPS | Extruded board | No | PS | Antioxidants, fillers, flame retardants possible |
| Weathered PS microplastic fragments from the environment | Irregular, no specific size, broad size distribution | Carbonyl groups, adsorbed biomolecules, microbes, and abiotic materials | Depending on the source | Depending on the source: antioxidants, fillers, flame retardants possible |
| Commercial spherical PS microbeads | Spheres, sizes ranging from a few nm to sub-mm, with narrow size distribution | For example, amino, carbonyl, carboxyl, hydroxyl, epoxy, sulfate, sulfonate, or aldehyde groups | PS, crosslinked PS, PMMA | Fluorescent dyes |
Table adapted from Addressing the relevance of polystyrene nano- and microplastic particles used to support exposure, toxicity and risk assessment: implications and recommendations.
Commercial polystyrene materials such as GPPS, HIPS, EPS, and XPS generally begin as pellets, beads, or boards with relatively defined compositions. Weathered polystyrene microplastic fragments, however, have irregular shapes, broad size distributions, and surface chemistries altered by environmental exposure. Their surfaces can contain carbonyl groups, adsorbed biomolecules, microorganisms, and other abiotic materials. By comparison, commercial spherical polystyrene microbeads often have narrow size distributions and intentionally added surface functional groups or fluorescent dyes.
These differences matter because particle shape, surface chemistry, additives, weathering, and biological coatings can influence transport, exposure, and biological interactions.
However, commercial microspheres remain useful for controlled mechanistic studies, particularly when researchers want to isolate the effects of properties such as particle size or surface charge. The limitation arises when researchers extrapolate those results directly to environmentally relevant exposure.
Why Characterization Requires Multiple Methods
Frequently Used Analytical Methods to Characterize Microparticles
| Purpose | Methods |
|---|---|
| Particle detection | Optical microscopy |
| Particle detection | AFM |
| Particle morphology (size and shape) | DLS |
| Particle morphology (size and shape) | SEM |
| Particle morphology (size and shape) | TEM |
| Composition (polymer type, additives, fillers, surface functional groups) | µFTIR |
| Composition (polymer type, additives, fillers, surface functional groups) | µRAMAN |
| Composition (polymer type, additives, fillers, surface functional groups) | Py-GC–MS |
| Composition (polymer type, additives, fillers, surface functional groups) | LDIR |
| Composition (polymer type, additives, fillers, surface functional groups) | XRF |
| Composition (polymer type, additives, fillers, surface functional groups) | EDX |
| Composition (polymer type, additives, fillers, surface functional groups) | H-NMR |
| Detection of surfactants and dispersants | HPLC–MS |
| Particle surface area, surface charge, porosity | Electrophoretic light scattering (Zeta potential) |
| Particle surface area, surface charge, porosity | BET |
| Particle surface area, surface charge, porosity | Potentiometric titration |
| Molecular weight distribution | GPC |
Table adapted from Addressing the relevance of polystyrene nano- and microplastic particles used to support exposure, toxicity and risk assessment: implications and recommendations.
Researchers use optical microscopy and AFM for particle detection and surface characterization, while techniques such as DLS, SEM, and TEM provide complementary information about particle size and morphology. Techniques such as µFTIR, µRaman, Py-GC–MS, and LDIR help determine polymer composition and other chemical characteristics. Additional methods can evaluate surface charge, porosity, molecular weight distribution, and substances associated with particle surfaces.
Importantly, these methods do not all measure the same property. Some provide particle-level information, while others measure polymer mass or chemical composition. Together, they demonstrate why defining a “representative” microplastic requires a broader understanding of both particle chemistry and physical properties. No single measurement can fully describe the complexity of an environmentally weathered particle.
Connecting Particle Properties to Risk Assessment
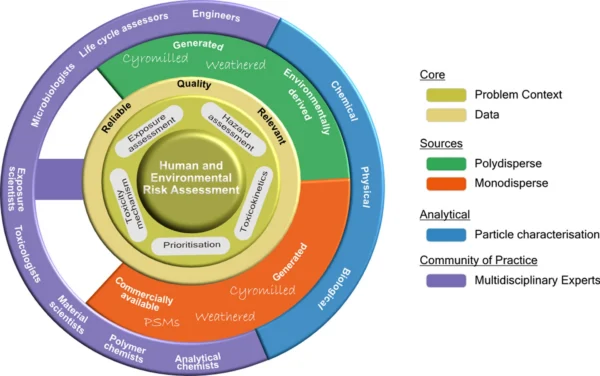
Conceptual framework to set priorities in the context of prioritizing the acquisition and properties of the best model NMPs necessary to advance the ability to evaluate their human and environmental risks. Each shell represents a key element, and spokes illustrate direct connectivity between key elements. Courtesy of Addressing the relevance of polystyrene nano- and microplastic particles used to support exposure, toxicity and risk assessment: implications and recommendations.
The framework distinguishes between monodisperse commercial particles and more environmentally relevant polydisperse particles generated through weathering or controlled preparation. Analytical characterization connects those particle sources to meaningful exposure and hazard assessment. Meanwhile, polymer chemists, analytical chemists, toxicologists, microbiologists, exposure scientists, engineers, and life-cycle specialists contribute different expertise.
Ultimately, researchers must determine whether a laboratory particle reflects the size, morphology, chemistry, and surface characteristics of materials encountered under real exposure conditions. Developing representative reference particles and standardized characterization approaches will therefore remain essential for making microplastics studies more comparable and relevant to environmental and human-health assessment.

Juliana Montoya is Director of Content for Plastics Engineering. A mechanical engineer with an MSc in materials engineering, she has experience as a sustainability and packaging consultant focused on ecodesign and recycling. Her work centers on technical content for the plastics industry, connecting polymer innovation, manufacturing trends, and sustainability strategy for industry audiences.