
In-Line Raman Spectroscopy Reveals Material Changes During Extrusion
Featured Sponsor Content
In-line Raman spectroscopy and rheology can reveal material changes during extrusion, helping track resin changeovers, viscosity, and process stabilization.
Extruders generate extensive process data, including temperature, screw speed, torque, pressure, feed rate, and residence time. These parameters describe the conditions applied to a material, but they do not directly reveal chemical or structural changes inside it.
You can also read: ANTEC 2026: Rheology Understanding Leads to Competitiveness
That distinction becomes important during resin changeovers, reactive extrusion, or compounding processes designed to reach a defined material state. Process parameters show what the equipment is doing, while direct material measurements show how the material is responding.
Bringing the Measurement into the Process
Polymer characterization usually occurs after processing, whereas in-line analysis measures the material while the process is still underway. As a result, operators can reduce the gap between what happens inside the extruder and what laboratory measurements later reveal.
Raman spectroscopy can support this approach by providing real-time information about molecular and spectral changes as processing continues. By positioning a Raman probe inside the extruder, researchers can repeatedly collect spectra while material moves past the measurement point. They can then track spectral changes and link them to shifts in the material during processing.
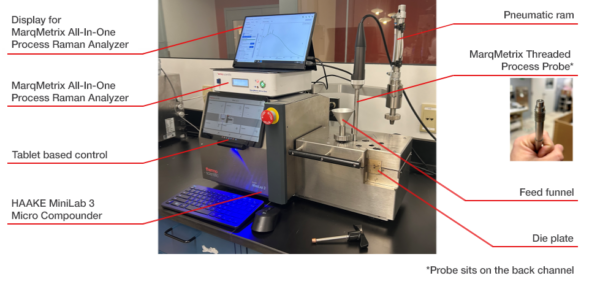
An integrated micro-compounding and in-line Raman setup measures material as it is processed, reducing reliance on post-process sampling alone. Courtesy of Thermo Fisher Scientific.
Peer-reviewed research further supports this approach because Raman measurements have already been applied successfully during reactive extrusion. For example, one study used in-line Raman spectroscopy and combined spectral measurements with multivariate analysis to track chemical changes during processing.
However, the practical value does not come simply from collecting more spectra during extrusion. Instead, it comes from translating spectral data quickly enough to provide useful information about material and process state.
Watching a Material Changeover as It Happens
A polymer changeover offers a straightforward example because you can follow the material transition as it moves through the system. Researchers studying real-time polymer extrusion monitoring combined a process Raman analyzer with a laboratory-scale twin-screw extruder.
They compared low-density polyethylene (LDPE) with polylactic acid (PLA), which produced clearly distinguishable Raman responses during the experiment. LDPE measurements also changed with physical state, because spectral features associated with crystalline pellets shifted after the polymer melted. Therefore, the measurement distinguished not only polymer identity but also a physical transformation caused by the extrusion process.
During the changeover from LDPE to PLA, PLA-related spectral features appeared about 30 seconds after the measurement point. At the same time, LDPE-related features diminished, allowing researchers to observe the material transition directly as the process continued.
Researchers then applied principal component analysis (PCA), which reduced spectral variation into a smaller number of meaningful components. As a result, the evolving spectra became easier to interpret as a time-based visual trend rather than many individual measurements.
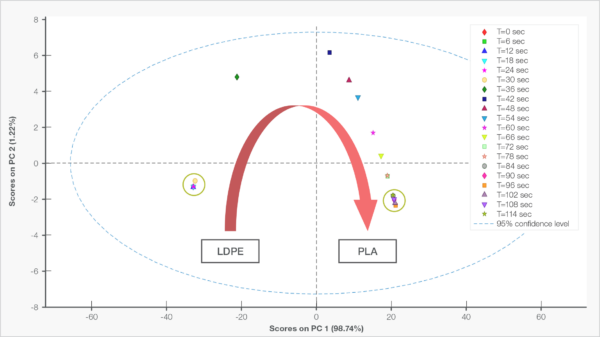
PCA visualization tracking the LDPE-to-PLA transition during extrusion, showing how a material changeover can be observed as it progresses through the process. Courtesy of Thermo Fisher Scientific.
Early observations fell within the LDPE region, while later observations progressively shifted toward the PLA region as processing continued. Under these experimental conditions, measurements stabilized within the PLA cluster after approximately 84 seconds.
That 84-second result applies only to this experiment because changeover behavior depends strongly on materials, equipment, and operating conditions. Still, the broader finding remains important: an in-process material transition can be observed and represented as a measurable trend.
Changeover monitoring reveals which material is present, but process development often requires a deeper understanding of how properties are changing. For that reason, researchers can combine Raman spectroscopy with complementary analytical methods such as rheology.
Connecting Material State to Rheological Properties
During reactive extrusion, heat, shear, mixing, and residence time can drive significant chemical and physical changes within a formulation. Raman spectroscopy can track changes in spectral response, while rheometry provides complementary information about how the material flows.
A starch plasticization study demonstrated this approach using starch, glycerol, and polybutylene succinate (PBS) in a micro-compounding system. Researchers processed the formulation on a twin-screw micro-compounding platform equipped with in-line Raman measurement.
The system’s recirculation channel also allowed them to measure viscosity while the Raman probe continuously monitored the same material. Rheology described how the material flowed, whereas Raman spectroscopy provided information about changes in its spectral response.
As processing continued, viscosity decreased, which researchers linked to increased molecular mobility during starch plasticization. Changes in mixing and structure within the starch-rich phase also contributed to the evolving rheological behavior. Meanwhile, Raman measurements changed in parallel, providing another perspective on how the material developed throughout processing.
Linking Spectral Data to Viscosity
Because researchers collected Raman spectra and viscosity data from the same evolving material, they could test a quantitative relationship. Partial least squares analysis produced an R²CV of 0.71 when researchers included the dataset’s transient beginning.
However, R²CV increased to 0.93 when the model used the more consistent middle and final processing periods. This result highlights an important modeling principle because analytical data must represent the process state a model intends to describe.
The initial measurements reflected a distinct, still-evolving process state rather than simply producing less favorable statistical results. Therefore, researchers did not remove those data merely to improve model performance or strengthen the reported correlation.
Instead, separating the processing windows revealed how strongly changing material conditions influenced the relationship between Raman response and viscosity. The resulting model showed that the spectral data contained information about the material’s evolving rheological state.
That finding led to another practical question: Could the measurements also indicate when the material stopped changing significantly?
When Does the Material Stop Changing?
The established procedure specified a 15-minute compounding period, providing a fixed processing time for comparison with material measurements. For the stabilization experiment, researchers processed the formulation at 150°C and 310 rpm while Raman continuously monitored the material.
They used PCA to visualize the material’s trajectory across the full run and identify changes in spectral behavior. Early observations spread widely across the PCA space because the material was changing rapidly as compounding began.
However, successive observations moved closer together as processing continued, eventually converging into a tighter cluster. At approximately seven minutes, an overlapping cluster emerged and remained visible in subsequent measurements.
Later observations continued occupying the same region, even though the prescribed compounding procedure continued until 15 minutes.
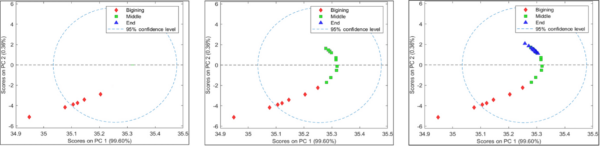
PCA visualization showing the onset of spectral/process stabilization at approximately seven minutes, providing material-state information beyond the predefined processing time alone. Courtesy of Thermo Fisher Scientific.
The industry partner later validated this observation using differential scanning calorimetry, which provided complementary post-processing evidence. However, the result does not establish complete chemical conversion or prove that seven minutes represents an optimal processing endpoint.
It also does not demonstrate that the prescribed 15-minute processing period should automatically be reduced. Instead, the measurements indicate convergence toward a stable spectral and process state under the specific conditions tested.
That distinction matters because elapsed time only indicates how long the material has undergone processing. By contrast, the analytical response shows whether the material itself continues to change.
From Process Settings to Material State
The relevant process question depends on the application, although the underlying need for direct material information remains similar. Operators may need to identify steady state during continuous extrusion or determine when a material changeover has finished.
In other cases, the goal may be detecting when a reactive or time-dependent process reaches a desired material state. In every case, equipment parameters remain essential because they describe the conditions controlling the process.
However, direct material measurements add another layer of evidence that can support process interpretation and decision-making. The distinction can be summarized simply:
Process conditions describe what is being done to the material, while material measurements reveal how the material is responding.
Combining both types of information allows engineers to move beyond one familiar question:
“What is my extruder doing?”
Instead, they can ask a more useful one:
“What is my material doing—and what does that tell me about the process?”
This article is sponsored content from Thermo Fisher Scientific, written by Lucivan P. Barros Jr., Ph.D., and Janam Pandya, Ph.D., and edited for online publication by MSc. Juliana Montoya.

Juliana Montoya is Director of Content for Plastics Engineering. A mechanical engineer with an MSc in materials engineering, she has experience as a sustainability and packaging consultant focused on ecodesign and recycling. Her work centers on technical content for the plastics industry, connecting polymer innovation, manufacturing trends, and sustainability strategy for industry audiences.